
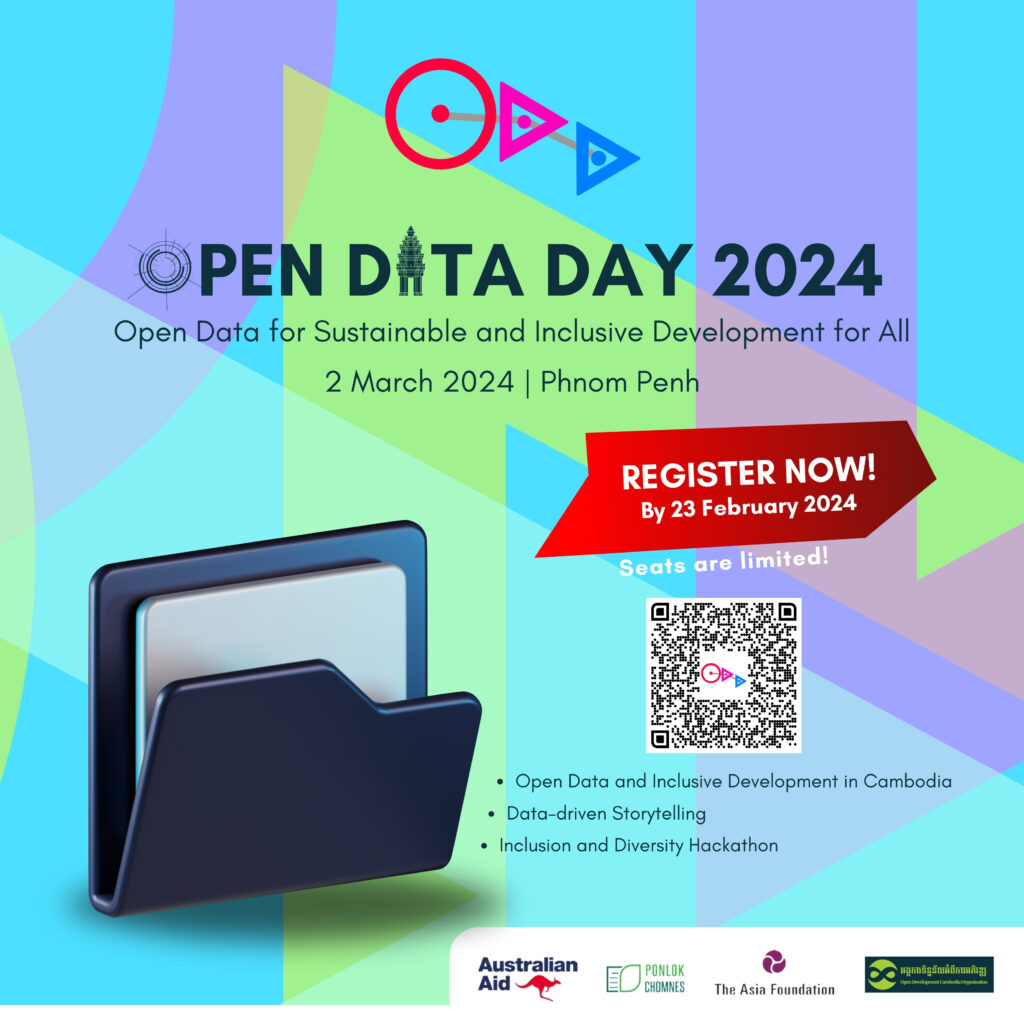
Open Development Cambodia Organization (ODC), in partnership with The Asia Foundation (TAF) will host the Open Data Day (ODD) on 2 March 2024, focusing on “Open Data for Sustainable and Inclusive Development for All.”
The ODD 2024 will provide a safe space for marginalized and vulnerable groups to express their concerns, share their experiences, and be exposed to talk on open data and digital development in Cambodia. Various activities, including keynote speeches, presentations from open data experts, and hackathons, can enlighten marginalized and vulnerable groups’ knowledge of open data and sustainable development in Cambodia.
The event is funded by the Australian Department of Foreign Affairs and Trade through the Asia Foundation’s Ponlok Chomnes: Data and Dialogue for Development in Cambodia Program.
Don’t miss this chance to network with other open data enthusiasts, learn new skills, and contribute to a more open and inclusive world. People with disabilities are encouraged to participate.
Register now: http://tinyurl.com/m78knss7
Other Events
Cyber Security and Data Literacy Training
The training course aims to: Raise awareness of the cluster member on cyber security as well as digital securityincluding password management, safe internet browsing, email security, and mobilesecurity. Enhance the understanding of data, data standards, and interactive visualization.
2025 OGP Global Summit
In late 2025, the Government of Spain will host the 2025 Open Government Partnership (OGP) Global Summit in Vitoria-Gasteiz, Spain. The Summit will bring together more than 2,000 high-level representatives of governments, civil society leaders, and policy-makers from around the world to exchange experiences, best practices, and progress on open government initiatives and implementation on key issues. At the 2025 OGP Global Summit, we will recognize the most promising and impactful reforms submitted to the Open Gov Challenge through the Open Gov Awards, celebrating innovation and progress in open government.
Fifth Global Media and Information Literacy Youth Hackathon
Theme: Youth powering media and information literacy in digital spaces The UNESCO annual Global Media and Information Literacy Week is a major occasion for stakeholders to review and celebrate the progress achieved towards “Media and Information Literacy for All.” The Global Media and Information Literacy Youth Hackathon is an integral part of the Global Media and Information Literacy Week Youth Agenda Forum. It is an opportunity for young people and youth organizations worldwide to participate in creating innovative MIL learning in meaningful ways. Following the previous four successful editions, the fifth Global Media and Information Literacy Youth Hackathon will be held during Global MIL Week 2023. UNESCO and partners call on youth worldwide to participate in this virtual hackathon to design innovative solutions to a defined set of social challenges, in connection with the year’s theme: “Youth powering media and information literacy in digital spaces.” Youth from schools, universities, youth centers, youth organizations, and young leaders from around the globe are invited to participate. The winning teams and the outcome of the Hackathon will be presented during the Global MIL Week Youth Agenda Forum 2023. Timeline 1 July 2023: Registration opens 1 August 2023: Registration ends Between 5-10 August 2023: Two-day mentoring on MIL and the hackathon 15 August 30 September 2023: Hacking processes (teams meet to hack issues and develop solutions) 1 October 2023: Deadline for submission of pitches (submission advised before the deadline) 2-10 October 2023: Judging process 25 October 2023: Announcement of winners and presentation of projects during the Global MIL Week 2023 Youth Agenda Forum. Registration: https://indico.un.org/event/1005900/registrations/ For more information: https://www.unesco.org/en/media-information-literacy-week/fifth-youth-hackathon