
Data visualization training in journalism
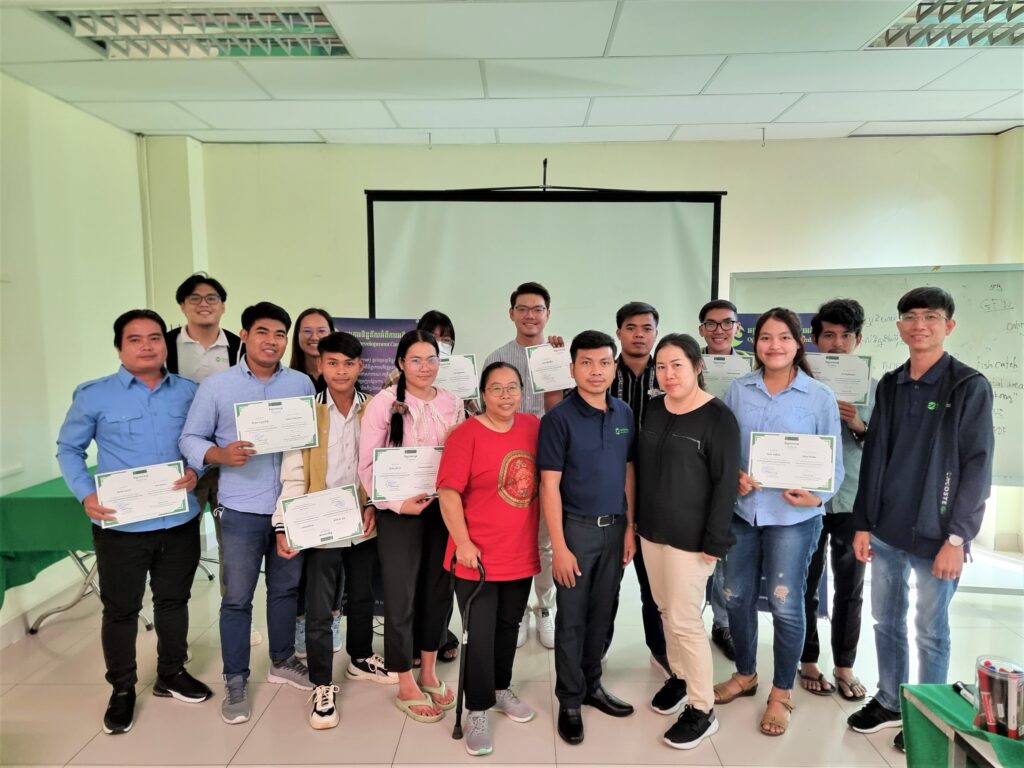
On September 11th, 2023, Open Development Cambodia (ODC) conducted an enriching training session titled \"Data visualization in journalism,\" attended by a group of 14 journalists (2 females) from various locations such as Phnom Penh, Kratie, Siem Reap, Battambang, Stung Treng, and Mondulkiri. With our \"Data visualization in journalism\" training, the trainees can embark on a transformative journalistic journey that explores the intersection of data and narrative. Data visualization, the art of transforming raw data into compelling visuals, is more than a skill; it\'s a narrative accelerator. In an age when information bombards our senses, journalists with data visualization skills gain the ability to change complex datasets, transforming them into impactful graphs, interactive charts, and dynamic maps that bring stories to life. This course provides an opportunity to seamlessly combine journalistic skills with data-driven precision, unleashing the potential of visual storytelling to captivate, inform, and inspire. The training aims to equip journalists with the skills to integrate visual elements into their storytelling, enabling them to convey information, engage audiences, and unveil deeper narratives through impactful and accessible graphics. The primary objective of this training initiative is to equip journalists with the proficiency to incorporate visual elements into their narratives. By doing so, they acquire the ability to convey information effectively, engage their audiences, and unveil deeper layers of the narrative through compelling and easily comprehensible graphics. The comprehensive training program explored data comprehension, the principles of data interpretation, the art of chart design, and an introduction to the powerful data visualization tool, Datawrapper. Despite the constraints of time, the participating journalists displayed remarkable adaptability and tenacity, successfully producing visualizations and integrating them into their stories. These hardworking trainees exhibited a worthy commitment to learning this new tool and the concepts surrounding it. Their dedication resulted in the creation of 14 interactive visualizations, each addressing a diverse selection of topics using Datawrapper. While it is acknowledged that their efforts may not yet be considered professional, it is evident that they have acquired a fundamental understanding of how to develop visualizations that enhance their news articles. Furthermore, it notes that the majority of these participants have expressed a strong desire for additional training sessions. They are eager to extend the duration of training and remain enthusiastic about staying updated with the latest data and visualization techniques. These aspirations reflect their solid commitment to enhancing their capacities as journalists and their dedication to delivering high-quality journalistic content to their respective audiences. The project is funded by USAID Cambodia through FHI 360 under a Cluster Anchor Grant from the Civil Society Support (CSS) Project.
Data Literacy Training to Cluster Members
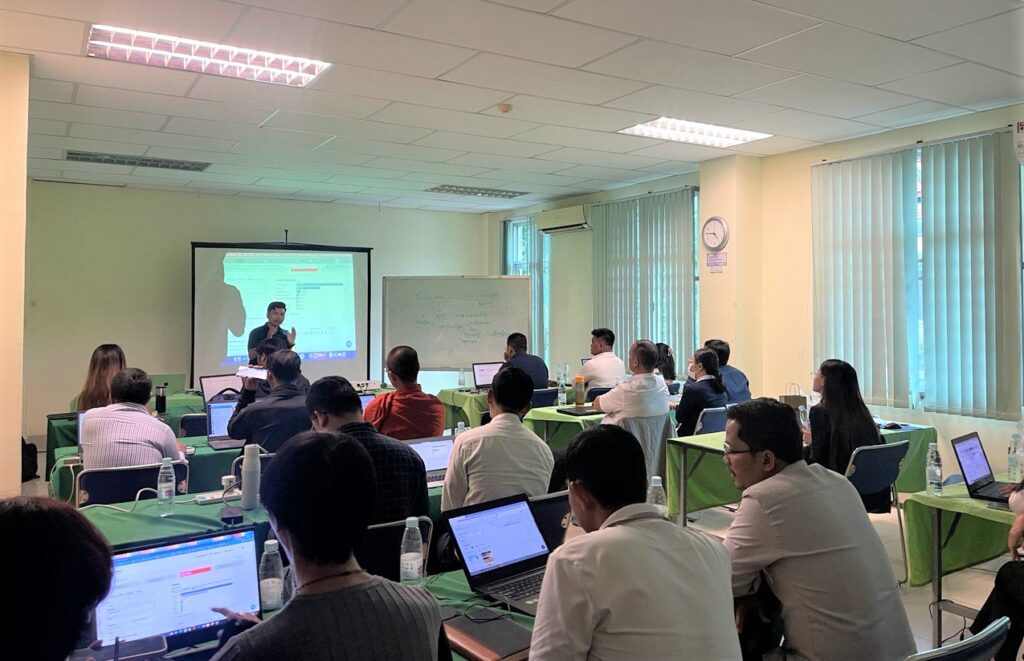
Open Development Cambodia (ODC) conducted data literacy training for Civil Society Support-Cluster members and their networks on 04th July 2023. The training course is designed to improve participants\' understanding of data, data standards, and interactive visualization. We also trained participants data visualization skills. This skill is expected to improve their data visualization in reporting. There are 31 participants (11 females) from ADHOC, NEP, YEA, Epic Arts, CHRAC, SVC, Bophana Centre, CENTRAL, LoveIsDiversity, and other networks took part in the training. Mr. Vong Pisith, Senior Data Research & GIS Officer/Capacity Building Coordinator of Open Development Cambodia (ODC), kicked off the training by introducing the general concepts and overview of data literacy and why it is important for the participants. He asked the participants to take the pre-test to assess their capacity. He then began the lesson with the topic \"Understanding data\" to ensure that the trainees understand what data is, the different types of data (qualitative and quantitative data), and the data format. The trainees were then introduced to the data standard: understand data format and tabular data standard. Furthermore, the data visualization principle: How to choose the right chart type for data presentation was emphasized. The session was discussed why we need data visualization, what data visualization is, how to choose the right chart type, and what to consider when visualizing data. Finally, the trainees were given the post-test and evaluation to complete. The training was conducted as part of the Civil Society Support (CSS) Project, which was funded by the United States Agency for International Development (USAID) through Family Health International (FHI 360) under the Learning Platform (LP).
Data visualization and storytelling training
Open Development Cambodia (ODC) hosted a training on \"Data visualization and storytelling\" on December 20-21 and 26, 2022, with 24 participants, including journalists, citizen journalists, indigenous youth journalists, journalism students, and CSOs. People with disabilities and LGBTQIA+ are encouraged to join. This training was divided into two parts. The first stage was a two-day online training that included lessons and exercises. The second phase was a one-day physical training session focused on recapping the entire training and exercises. This training was funded by USAID Cambodia through FHI 360 as part of the Civil Society Support (CSS) Project\'s Cluster Anchor Grant. Day 01: Understanding data Before the session began, an ODC representative made a welcoming remark about the project and an introduction to help the attendees get to know one another. Following that, the participant spent time preparing for the pre-test, which was used to assess their capacity before the program began. Mr. Vong Pisith, the trainer, began the lesson on understanding data to provide insight into the importance of data, the different types of data and information, and the transparency of open data. After everyone understood the data well, the trainers demonstrated how to find it using the data portal and Google advanced search. The participants were then given an exercise by finding their needs data in PDF format and other natural resource data on the ODC portal. The trainer, Mr. BAN Chanphalla, then moved on to the next lesson on data standardization, which instructed the participants about data standards and how to format their data before diving into data visualization. The participants were introduced to the function of creating a new spreadsheet, adding sheets, making a copy, columns, and rows, inserting charts, filtering, and pivoting tables on google sheets, as well as importing comma-separated values (CSV) files into the spreadsheet and Microsoft Excel. The trainers also illustrated the data clean as a significant part of the data analysis. This lesson explained why we need to clean data and introduced them to a method for cleaning data to make it legible by introducing techniques such as trimming whitespace, removing duplicates, formatting text, splitting columns, data validation, and finding and replacing. Day 02: Data visualization On the second training day, the trainers took a few minutes to review the previous day\'s lesson before continuing with Mr. Sam An Mardy\'s agenda on data visualization principles. The trainer will introduce what motivated us to create the visualization, what exactly the data visualization is, how to tell a data-driven story, how to choose the right graph and chart type, and how to display it correctly. Mr. Vong Pisith then showed the participants a demonstration and examples of the Flourish. The participants then continue working on the group exercise to create the chart and graph with Flourish. Everyone took the post-test at the end of the second day and looked forward to the physical training on the third day. Day 03: Individual practice The agenda for the last day of training covered lesson reminiscence. Everyone attended the physical training and continued the lesson on data visualization with Flourish. The participants started learning how to make a map chart out of geographical data and how to incorporate those visualizations into the story. Then the participants were given the opportunity to practice it independently and complete the individual assignment by creating storytelling using data visualization. Finally, the trainees were asked to evaluate before closing remarks and provide the training certificates.